Margin leakage rarely arrives as a visible crisis. It is a slow drain that surfaces only after it has cost EBITDA hundreds of thousands to millions of euros — depending on the scale of the organization.
Industrial B2B businesses lose, on average, 2 to 5 percentage points of net margin to invisible pricing leakage. In a sector where 8 to 12% EBITDA margin is already healthy, that is not a topic for optimization. It is existential. And the most insidious aspect: leakage rarely sits in one identifiable place. It is dispersed across hundreds of small decisions that each look defensible — yet collectively erode margin at a structural pace.
The five signs below are the patterns that surface most frequently in pricing diagnostics across industrial mid-market and SME organizations. One sign is a warning. Three or more means the pattern has become structural — and that holds true for the majority of industrial businesses without a formal pricing discipline.
Key takeaways
- The average industrial mid-market business leaves 2 to 5 percentage points of net margin on the table through margin leakage that manifests in five predictable ways.
- Off-invoice leakage (rebates, freight surcharges, payment-term costs, marketing contributions) averages 15 to 30% of list price and is rarely monitored centrally.
- Discount drift — discounts that grow incrementally without conscious decision — is the most universal pattern.
- The whale curve shows that 10 to 20% of customers actively destroy 50 to 80% of potential profit. This is not anecdotal. It is measurable.
- Stopping leakage does not begin with software. It begins with honest reading of your own data. Diagnosis precedes solution — always.
Sign 1 — The gap between gross and net margin grows, and no one can explain why
Your P&L shows that gross margin is stable. Net margin is declining. The CFO asks why. No one has a complete answer, because the loss is not in a single line — it is dispersed across rebates, freight charges, payment-term costs, marketing contributions, and goodwill credits.
This is the classic phenomenon McKinsey described in Harvard Business Review in 1992: the difference between list price, invoice price, and pocket price — what you actually retain after all deductions. For most industrial B2B businesses, pocket price sits 20 to 30% below invoice price. And off-invoice leakage — everything that happens after the invoice — can reach a third of list price.
"The problem is not that you grant discounts. The problem is that you do not know which ones you grant, to whom, for what reason, and whether that reason still applies today."
What you are likely to see in the data:
- A widening year-on-year gap between gross margin (above the line) and net margin (below all off-invoice items).
- Customers with identical volumes and product mix, but pocket margins that differ by 4 to 8 percentage points.
- Rebates that no longer match original contract terms, because "that is what we agreed back then" — but no one remembers why.
This is sign number one because it exposes the foundational blindness: you cannot manage what you do not measure. And most organizations do not measure pocket price. They measure invoice price and assume the rest is acceptable.
Sign 2 — Discount drift: discounts no one consciously granted
Discount drift is the pattern in which discounts grow incrementally without anyone making a formal decision. The account manager who granted 8% in 2019 to close a deal grants 14% in 2026. Not because the market has changed. Because "that customer simply gets that discount now."
Three indicators of discount drift:
1. High variance in discount levels within comparable customer segments. When two customers with the same revenue, sector, and order pattern differ by more than 5 percentage points in net discount, without a pricing policy that justifies the difference, that is not segmentation. It is arbitrariness.
2. Discounts that only move upward, never downward. With every contract renewal, the discount rises by half to one percentage point. Once is a negotiation. Five years in a row is a slow drift toward cost — without anyone explicitly approving the path.
3. Exception discounts concentrated at quarter-end. When 60% of discount exceptions are granted in the last week or ten days of a quarter, you know that the quarter cycle is setting your pricing — not your commercial strategy.
Discount drift is not malice on the part of the sales team. It is a rational response to a system that rewards salespeople on revenue, not on margin. When targets are tied to volume and there are no guardrails, salespeople use the tools they have. Discount is always the easiest tool.
The fix is not stricter approval workflows. It is margin governance — a framework in which every discount has a purpose, an end date, and a measurable outcome. That is Policy in the Pricetainability™ cycle.
Sign 3 — End-of-quarter peaks without margin contribution
In most industrial B2B organizations, revenue peaks in the last two weeks of every quarter. This is often celebrated as "the team hitting its number." But peaks are only profit if they bring margin. And usually, they do not.
Plot this chart for your own business across the last eight quarters:
- X-axis: weeks in the quarter (1 to 13)
- Y-axis 1 (line): revenue per week
- Y-axis 2 (line): net margin percentage per week
In a healthy commercial organization, both lines move in the same direction. In an organization with margin erosion, you see the opposite pattern: revenue peak in week 12 or 13, margin dip in the same period. This is not coincidence. It is a team pulling deals forward by conceding on price.
An anonymized example from practice: A European manufacturer of industrial connection systems, €72 million revenue, discovered that 38% of its annual discount budget was granted in the last two weeks of Q4. Average margin on those deals was 6.2 percentage points lower than on deals in weeks 1 through 11 of the same quarter. Annual impact: €1.8 million in avoidable leakage.
The problem is not the peak itself. The problem is that the peak is funded by margin instead of by commercial strength. Once you see the pattern in your data, you cannot unsee it.
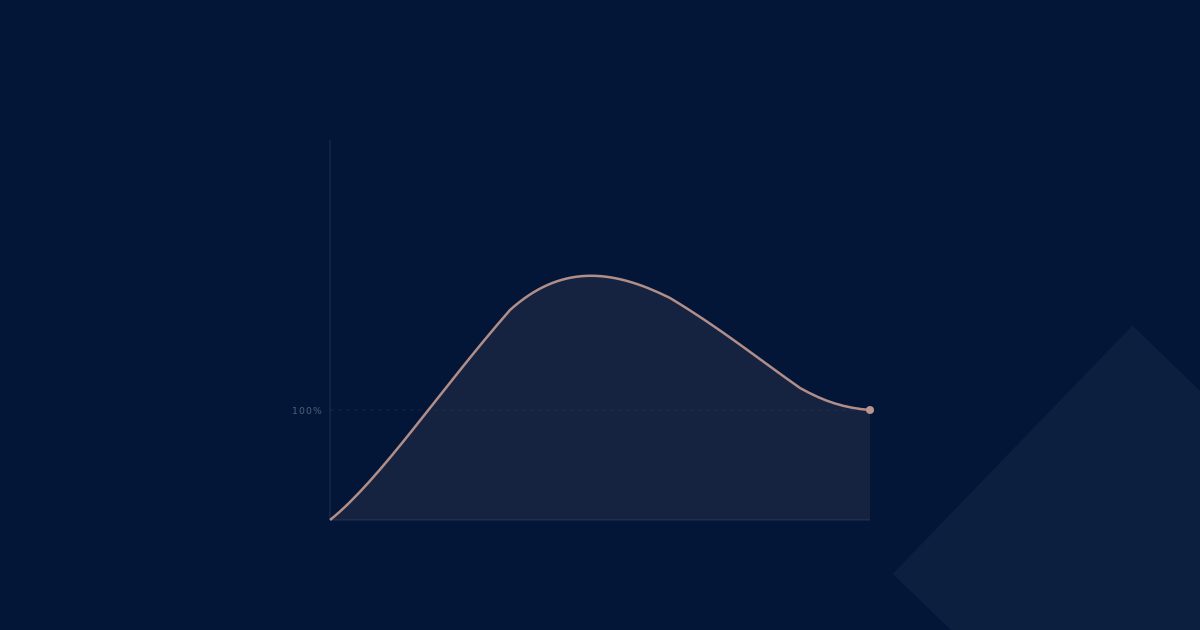
Sign 4 — The whale curve you have never plotted
Pareto taught us that 20% of customers generate 80% of revenue. In customer profitability, that rule no longer holds. The actual pattern is more dramatic and was documented by Harvard professors Robert Kaplan and V.G. Narayanan: the whale curve.
The whale curve shows that:
- The top 20% of customers generate 150 to 300% of net profit.
- The middle 60% are break-even — they produce revenue but contribute nothing net after cost-to-serve.
- The bottom 10 to 20% destroy 50 to 200% of potential profit.
In other words: if you removed the bottom 10% of your portfolio and redirected that capacity, net profit would rise — without a single additional euro of revenue. The chart is named for its shape — a whale's back surfacing: steep climb, plateau in the middle, sharp drop at the end.
"Between sensing which customers are difficult and knowing which customers are actually destroying margin, there is often more than a million euros in misdirected discount. The difference between those two states is a diagnostic."
Why most organizations do not have this chart:
- ERP data contains the information, but no one has assigned cost-to-serve at the customer level.
- Sales reports on revenue, not on margin after cost-to-serve.
- No one wants to identify "the largest customer" as loss-making, because it is politically inconvenient.
But: without the whale curve, you allocate commercial capacity by intuition. And commercial capacity — not list price — is the scarce resource.
Sign 5 — Indexation clauses that were never applied
This sign became suddenly visible during the inflation cycle of 2022 and 2023. Many organizations discovered that their long-term contracts either contained no indexation clause, or contained one with no process to apply it.
The pattern:
- 2018 contract, fixed price, no indexation clause.
- Customer satisfied. No one raises the issue.
- 2024: input costs have risen 18%, contract price unchanged. Margin has evaporated.
- Renegotiation is now a crisis conversation rather than a routine matter.
Worse: contracts with an indexation clause that was simply not applied. Because the pricing manager left. Because it was "not the priority." Because no one has a clear inventory of which customers have which clause.
Indexation is not a complex discipline. It is, however, a discipline — and it is absent in most mid-market organizations. In practice, the simple application of existing indexation clauses — no new contracts, just executing what was already agreed — typically restores 1.2 to 2.8 percentage points of net margin within a single year.
This topic deserves its own treatment: Indexation in B2B: how contracts grow with costs.
What do you do with this?
The five signs may appear independent. They are not. They are all symptoms of the same underlying issue: a pricing system without real-time visibility, without consistent execution, and without governance that puts margin above volume.
Within the Pricetainability™ framework, these are the four phases:
- Truth — diagnostic grounded in facts. The whale curve, the pocket price waterfall, discount drift in your own data. Not opinion, only numbers.
- Policy — rules that translate facts into behavior: discount structure, customer segmentation, indexation clauses, discount mandates by role.
- Execution — implementation supported by tools (CRM, ERP, pricing analytics) and commercial processes.
- Governance — periodic review that prevents the organization from sliding back into old patterns. Without governance, every fix decays within 18 months.
The sequence is not negotiable. Starting at Execution (pricing software) without Truth (diagnostic) automates your existing leakage. Starting at Policy without Truth writes rules on assumptions.
Always begin at the diagnostic.
Bottom line
The five signs are not exotic. They sit in nearly every industrial B2B organization without a formal pricing function. The difference between businesses that leave 2 to 5 percentage points on the table and businesses that recover that margin is not software. It is the willingness to read their own data honestly.
Bain has shown that organizations that manage pricing as a discipline outperform their peers by 5 to 11 percentage points of EBITDA margin. That is not optimization. That is the difference between a healthy business and a struggling one.
The question is not whether the leakage exists. The question is how much it costs annually — and how long that situation remains acceptable.
Wondering where your profit margin is slipping away? Start with a diagnosis.
Request a Pricing Audit →